Linear Relationships

|
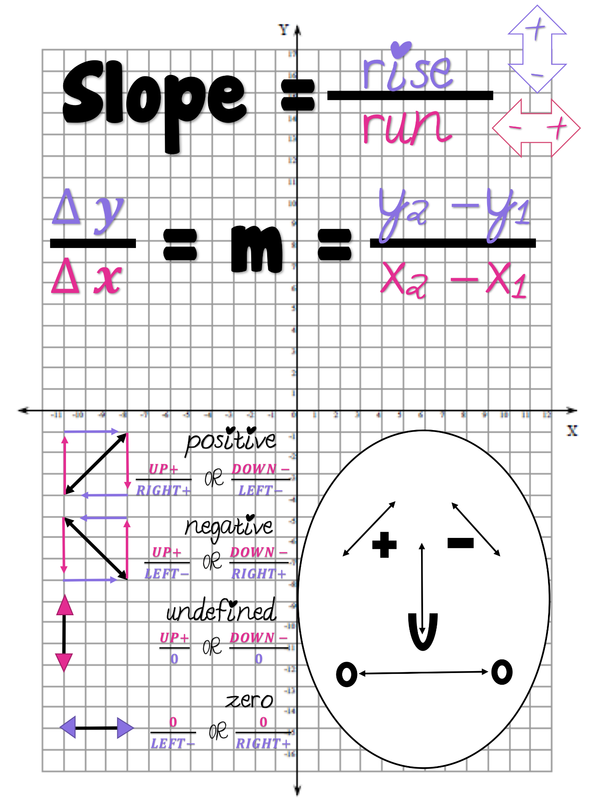
8.4(A) use similar right triangles to develop an understanding that slope, m, given as the rate comparing the change in y-values to the change in x-values, (y2 – y1)/(x2 – x1), is the same for any two points (x1, y1) and (x2, y2) on the same line
8.4(B) graph proportional relationships, interpreting the unit rate as the slope of the line that models the relationship 8.4(C) use data from a table or graph to determine the rate of change or slope and y-intercept in mathematical and real-world problems 8.5(A) represent linear proportional situations with tables, graphs, and equations in the form of y = kx 8.5(E) Solve problems involving direct variation 8.5(I) write an equation in the form y = mx + b to model a linear relationship between two quantities using verbal, numerical, tabular, and graphical representations |
| |||
|
|
